Collection
Module 5: Visualising Data
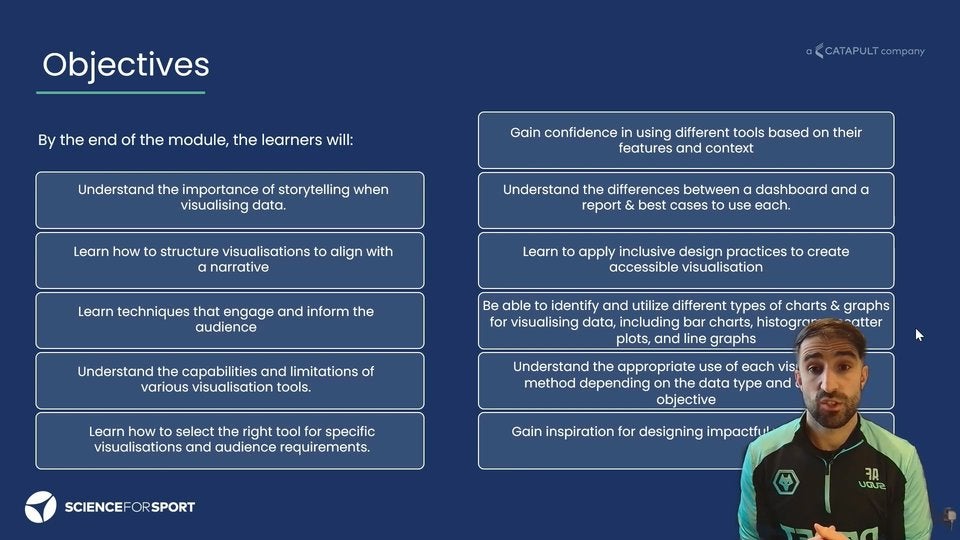
This course provides a comprehensive introduction to the principles, tools, and techniques of data visualisation. You will learn how to transform raw data into meaningful visuals that communicate insights effectively, support decision-making and drive action.
The course will also cover:
- The foundational concepts of visualisation
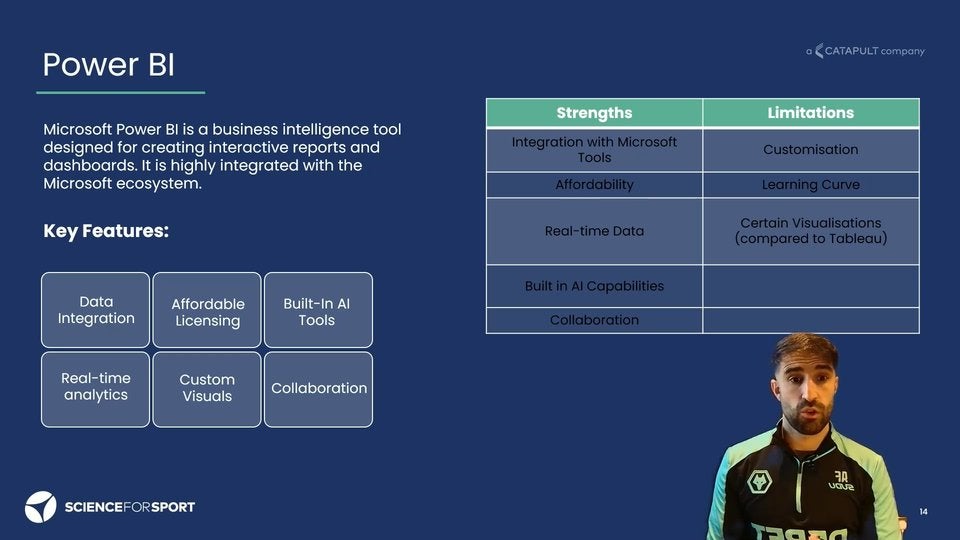
- Common visualisation tools
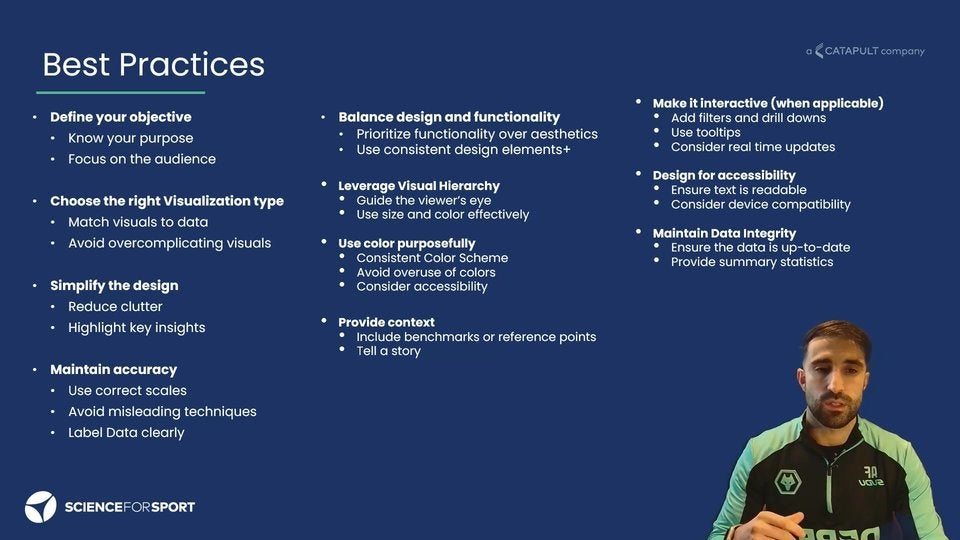
- Best practices to ensure clarity, accuracy, and impact.
The growing importance of data-driven decision making has made data visualisation an essential skill across the industry. This course will prepare you to communicate data effectively to diverse audiences and gain insights into best practices and pitfalls in visualisation.
Additional Resources
Showcases | Power BI Showcases by Enterprise DNA – For Visualisation Inspiration, which includes hundreds of visualisation examples, reports and dashboards.
Discover | Tableau Public – More visualisation inspiration. Tableau dashboards and reports which are accessible to the public.
Learn Data Science and AI Online | DataCamp – Thousands of courses where you can further upskill your visualisation and all data related courses.
Home | Data In Sport – Feel free to reach out via datainsport.com or email arianf@datainsport.com
Select a membership:
No memberships found.
Videos (6)